

Most enterprise finance teams treat sales tax non-compliance as a compliance problem. It’s actually a balance sheet problem and the numbers are large enough to matter at the board level.
Non-compliant SaaS businesses lose 4.3% of revenue on average due to payment of uncollected sales tax, penalties, and fines. For a company with $50 million in annual revenue, that’s $2.15 million in exposure, not as a worst-case scenario, but as an average. In New York, the average exposure reaches 11.3% of revenue for digital businesses. In Chicago, it’s 10.6%.
These figures are not theoretical. They are the documented outcomes when companies discover their “sales tax non-compliance costs” in the context of an audit, an acquisition, or a voluntary disclosure review. And the longer the non-compliance runs, the worse the math gets, because penalties and interest don’t accumulate linearly. They compound.
This framework gives enterprise CFOs and controllers a structured method for quantifying sales tax non-compliance risk before it becomes an audit finding.
Sales tax non-compliance costs enterprise companies an average of 4.3% of revenue, rising to 11.3% in New York and 10.6% in Chicago for digital businesses. A 3–4 year non-compliance period compounds to approximately 140% of the original tax owed when state penalties and interest are applied. State penalties range from 2% to 50% of base tax; interest rates range from 3% to 18% annually. California projects $736.5 million in sales tax audit revenue for 2026–2027. Voluntary disclosure agreements cap lookback periods at 3–4 years and waive penalties, typically reducing total liability by 40%–60% compared to state-initiated audit outcomes.
Sales tax non-compliance costs enterprise companies an average of 4.3% of total revenue when back taxes, penalties, and interest are combined. A 3–4 year compliance gap typically reaches 140% of the original tax owed after penalties and interest compound. In high-tax markets like New York, exposure reaches 11.3% of revenue for digital businesses. Voluntary disclosure limits lookback periods and eliminates penalties, significantly reducing total cost.
Why Sales Tax Non-Compliance Costs More Than Most CFOs Expect
The base tax owed is only the starting number. What turns a manageable exposure into a business-threatening liability is the compounding structure of state penalties and interest layered on top of it.
A 3–4 year liability equals approximately 140% of the original tax owed when penalties and interest stack up. That means a company that owes $500,000 in uncollected sales tax from a four-year compliance gap doesn’t face a $500,000 problem. It faces a $700,000 problem and that’s before professional fees for audit defense.
The state-by-state penalty structure varies dramatically, and the variation is not in the company’s favor:
| State | Late Payment Penalty | Max Penalty | Annual Interest Rate |
| Washington | 9% (1–30 days), 19% (31–60 days), 29% (60+ days) | 39% | 8% |
| Florida | 10% per 30 days | 50% | 12% |
| Arkansas | 5% per month | 35% | 10% |
| Wisconsin | Flat penalty | 25% | 18% |
| Rhode Island | Flat penalty | 25% | 18% |
| New York | 5–25% | 25% + fraud multiplier | 14.5% |
| California | 10% | 25% | 8% |
| Illinois | 2% flat | 20% | 9% |
A $120,000 compliance error in Washington State, with a 29% penalty applied, adds $34,800 in penalties alone, bringing the total liability to $176,400 before interest. Extend that exposure over three years with Wisconsin’s 18% annual interest rate, and the compounding effect transforms what started as a billing oversight into a material financial obligation.
The Six Cost Categories That Most Risk Assessments Miss
Enterprise finance teams that do attempt to quantify non-compliance risk typically count back taxes and penalties. That’s two of the six categories that make up the true cost. The others are where the exposure hides:
1. Back taxes owed
The uncollected and unremitted tax itself. Calculated as: taxable revenue × applicable state and local rate × number of periods exposed. This is the base number.
2. Penalties
Applied as a percentage of the base tax owed. Range: 2% to 50% depending on state and duration. Washington’s 39% maximum is the highest in the country for escalating violations. Florida caps at 50% for extended non-payment.
3. Interest charges
Applied to the base tax from the original due date, not from the date of discovery. Interest rates range from 3% (Nebraska) to 18% (Rhode Island and Wisconsin). At 18% annually compounding over three years, $100,000 in base tax becomes $160,000 before penalties are calculated.
4. Audit defense and professional fees
An audit response in a single state typically costs $15,000 to $50,000 in professional fees, depending on complexity and volume. A multi-state audit initiated simultaneously, which AI audit systems increasingly trigger, multiplies this cost by the number of states involved.
5. Internal resource diversion
During an active audit, the internal tax team and significant finance leadership time shifts to audit response. Routine filings, exemption certificate management, and ongoing compliance fall behind. This operational cost is real but rarely quantified in the risk assessment.
6. M&A valuation impact
Unresolved sales tax liability surfaces in due diligence. Acquirers require either a price reduction equal to the estimated exposure, an escrow holdback, or a seller-funded VDA before closing. Multi-year penalties can add up to millions, making historical exposure a significant risk for companies approaching M&A events. A company with $3 million in unquantified sales tax exposure can see deal value reduced by $4–6 million after the acquirer applies a risk multiplier.
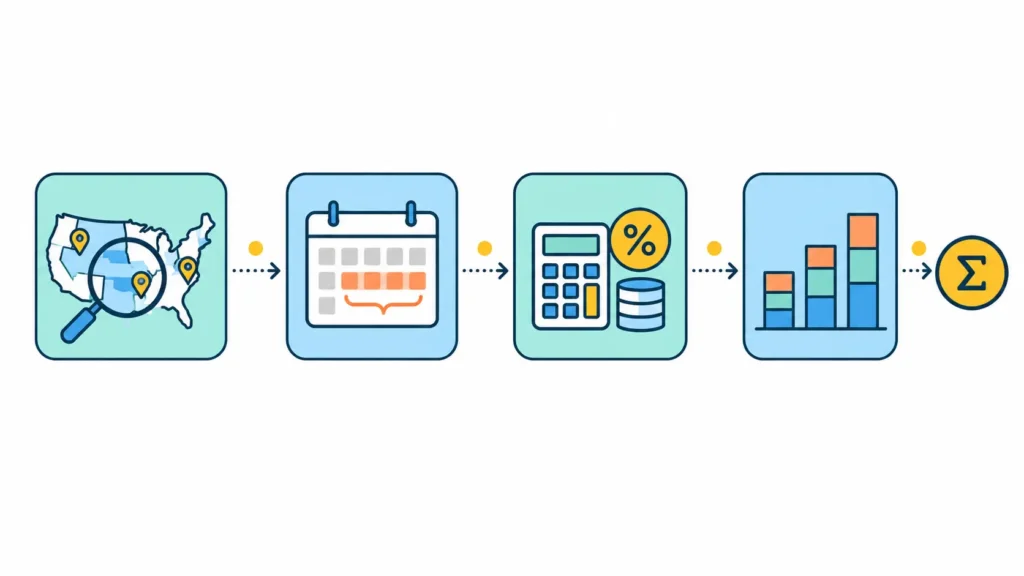
The Risk Quantification Framework: Four Steps
Enterprise companies that want to put a number on their sales tax non-compliance exposure before an audit or transaction event should follow this sequence:
Step 1: Map the nexus footprint.
Identify every state where the company has current or historical nexus, physical presence (employees, offices, warehouses, remote workers), economic nexus threshold crossings, and nexus created by acquired entities. This determines the universe of states where exposure potentially exists.
Step 2: Identify unregistered or under-filing periods.
For each nexus state, determine when nexus was first created and whether the company was registered for that full period. Unregistered periods represent full exposure. Under-filing periods (where the company filed but underpaid due to product miscoding or missed transactions) represent partial exposure.
Step 3: Calculate base tax exposure by state and period.
Apply the applicable state and local rates to taxable revenue in each unregistered or under-filing period. Use actual transaction data where available; where transaction-level data isn’t accessible, use a revenue sampling methodology by state.
Step 4: Apply the multiplier.
For each state, apply the applicable penalty and interest structure to the base tax figure. Use the actual statute for that state, not an average. A Washington State exposure calculated with California’s penalty structure will understate the liability by more than $100,000 on a $500,000 base.
The output of this framework is a state-by-state risk register with four columns: base tax, penalty estimate, interest estimate, and total maximum exposure. That number, not the base tax alone, is what belongs in the board presentation and the M&A disclosure schedule.
Where Enterprise Companies Carry the Largest Hidden Exposure
408 rate changes occurred in the first half of 2026 alone, a 24% increase from the prior year. A company that set its ERP tax codes at implementation and hasn’t reviewed them since is almost certainly applying stale rates to current transactions. That gap accumulates with every invoice.
The exposure concentration points for most enterprise companies are:
Unregistered states with economic nexus threshold crossings
A business growing from early-stage to enterprise sees its filing requirements multiply 47 times. A company that crossed the $100,000 threshold in Georgia two years ago and never registered has two years of uncollected Georgia sales tax accruing interest at 9% annually plus penalties from the original due dates.
Product taxability mismatches in high-rate jurisdictions
A SaaS company incorrectly classifying its software as non-taxable in Texas, which broadly taxes SaaS and generating $5 million annually in Texas revenue has a base exposure of approximately $413,000 per year (at an 8.25% combined rate) before penalties and interest.
Exemption certificate gaps at scale
Every tax-exempt transaction without a current, valid exemption certificate on file is a potential disallowance in an audit. At enterprise transaction volumes, the difference between a clean certificate file and a gap-riddled one can swing the audit outcome by six figures.
Remote employee-created nexus in unregistered states
A company with 12 remote employees across 8 states, hired over the past two years without triggering sales tax registration, may have nexus obligations in all 8 states simultaneously, each with its own uncollected tax period running from the employee’s first day.
What Voluntary Disclosure Changes About the Math
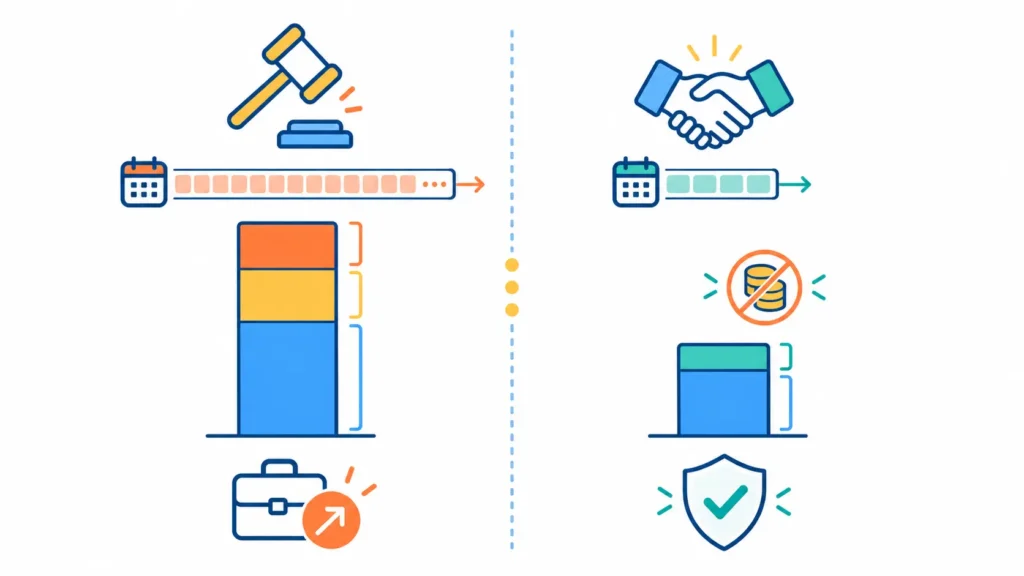
The risk quantification framework above assumes worst-case: a state-initiated audit with unlimited lookback and full statutory penalties. Voluntary disclosure changes the math in two significant ways.
First, it caps the lookback period. Most states limit VDA lookbacks to three to four years. A company with seven years of unregistered nexus in a state resolves four years of exposure under a VDA, not seven.
Second, it eliminates penalties entirely in most states. The 29% Washington penalty, the 50% Florida cap, the 25% New York maximum, all waived under a VDA. The company pays base tax and interest only.
On the $500,000 base tax example: a state-initiated audit at 140% multiplier produces a $700,000 liability. The same exposure resolved through a VDA, with a four-year lookback cap and penalties waived, may cost $300,000 to $380,000 in base tax plus interest for the capped period. The difference is $320,000 to $400,000 in real cash, plus the avoided professional fees of responding to a state-initiated audit.
That math is why the timing of the VDA decision matters as much as the decision itself. The window closes the moment the state makes contact.
Final Words
Sales tax non-compliance risk is not a compliance department problem. It belongs in the enterprise risk register with a dollar figure attached, calculated using the actual penalty and interest structures of each state where exposure exists, not a generic average.
California’s CDTFA projects $736.5 million in sales tax audit revenue for 2026–2027. That revenue comes from somewhere, from enterprise companies whose compliance data contained discrepancies that AI audit systems identified before any human auditor made a call.
The companies that avoid becoming part of that number are not the ones that got lucky. They are the ones that ran the quantification framework, found the exposure, and resolved it on their own terms before a state ran its own calculation for them.
Quantify Your Enterprise Sales Tax Risk Before an Auditor Does It for You
IST conducts sales tax risk quantification assessments for enterprise companies, mapping nexus footprints, identifying unregistered periods, calculating state-by-state exposure using actual penalty and interest structures, and recommending the most cost-effective resolution path, whether VDA, amended returns, or prospective registration.
The framework in this article is the starting point. The specific numbers for your company require your transaction data and your nexus footprint and those are what IST works with.
Frequently Asked Questions
What is the average cost of sales tax non-compliance for enterprise companies?
Non-compliant businesses lose an average of 4.3% of revenue to combined back taxes, penalties, and interest. For digital businesses in high-tax markets, exposure is significantly higher, 11.3% of revenue in New York and 10.6% in Chicago. For a company with $50 million in annual revenue, the average exposure translates to $2.15 million, not including audit defense fees or M&A valuation impact.
How do state penalties and interest compound sales tax non-compliance liability?
A 3–4 year sales tax compliance gap typically reaches 140% of the original tax owed when penalties and interest accumulate. States apply penalty percentages to the base tax from the original due dates, then charge interest on both the base tax and penalties from those same dates. At Wisconsin’s 18% annual interest rate, $100,000 in base tax becomes $160,000 in three years before penalties are added.
Which states have the highest sales tax non-compliance penalties in 2026?
Washington State imposes the highest escalating penalty structure, reaching 39% of tax owed for violations over 60 days late. Florida caps late payment penalties at 50% of the tax owed. Arkansas charges 5% per month with a 35% maximum. Rhode Island and Wisconsin both charge 18% annual interest, the highest interest rates in the country. New York doubles the unpaid tax for fraud findings.
How does sales tax non-compliance affect M&A transactions?
Unresolved sales tax liability appears as a contingent liability in due diligence. Acquirers typically require a purchase price reduction equal to the estimated total exposure, base tax plus penalties and interest or a holdback escrow. Multi-year non-compliance can reduce deal value by millions beyond the underlying tax amount because acquirers apply risk multipliers to unquantified exposure. Pre-closing voluntary disclosure is the most effective way to resolve this before it affects deal terms.
What is the difference between a state-initiated audit and a voluntary disclosure for cost purposes?
A state-initiated audit carries unlimited lookback for companies that never filed, full statutory penalties (up to 50% of base tax in some states), compounding interest from original due dates, and professional audit defense fees. A voluntary disclosure agreement limits lookback to 3–4 years in most states and waives all penalties. On a $500,000 base tax exposure, VDA resolution typically costs $300,000–$380,000 versus $700,000 or more under a state-initiated audit.
How many rate changes occurred in 2026 and why does it matter for compliance risk?
408 sales tax rate changes occurred in the first half of 2026 alone, a 24% increase from the prior year. Companies using static rate tables in their ERP or billing systems that were last updated at implementation are applying incorrect rates to current transactions. Each incorrect rate on each invoice is a calculation error that accumulates into an auditable discrepancy. Automated, real-time rate updates eliminate this category of non-compliance risk entirely.
How should enterprise companies calculate their total sales tax non-compliance exposure?
The risk quantification framework has four steps: 1: Map the nexus footprint, every state with physical or economic nexus, including unregistered periods. 2: Identify unregistered or under-filing periods per state. 3: Calculate base tax by applying applicable rates to taxable revenue for each exposed period. 4: Apply the actual state penalty and interest multiplier, not an average, to calculate maximum exposure per state. Sum the state figures for total enterprise exposure.
What does a sales tax risk register look like for board reporting?
An enterprise sales tax risk register contains four columns per state: base tax exposure (uncollected and unremitted tax by period), penalty estimate (using the actual state penalty schedule), interest estimate (compounded from original due dates), and total maximum exposure. The register is organized by state and priority-ranked by total exposure. It forms the basis for the board disclosure, the M&A due diligence package, and the voluntary disclosure prioritization decision.
Leave a Reply